OVERVIEW

OVERVIEW

GENERAL CONTROLS


INFOBAR
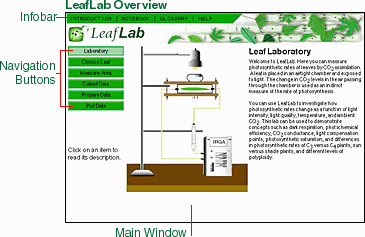
The tabs at the top of the screen allow you to access the Introduction, Assignments, Notebook, Glossary, and Help. This Infobar will be available on all screens of LeafLab.


RUNNING EXPERIMENTS

There are several different screens in LeafLab. You will need to use each screen to complete your experiments. A description and instructions for using each screen appears below.


Laboratory
Laboratory
Laboratory
It is important to review the different equipment portrayed in the laboratory in order to understand how photosynthetic rates are measured in the laboratory. Roll the mouse over each piece of equipment illustrated on the left until you see a red box outlined around the equipment. Click on the outlined area for a description of each piece of equipment and its function.

Choose Leaf
Choose Leaf
Choose Leaf
Allows you to choose one of six different types of leaves, each with different photosynthetic properties, to use in your experiment. Select the leaf name to see a detailed image of the leaf, its parent plant, and the plant's fruit.

Measure Area
Measure Area
Measure Area
Allows you to select a portion of the leaf to use in the experiment. Click once and drag over grid squares to measure the area of interior portions of the leaf. If a grid square is only partially covered by the leaf edge, click twice in the square to add a one-half grid to the area. The Clear Selection button in the bottom right corner allows you to clear your selection and start over.

Collect Data
Collect Data
Collect Data
Here you have several parameters you can alter in the experiment:

Gas Flow: Click Low, Medium or High - it is set at Off - to affect the rate of gas flow. Use Low for small leaves (fescue), Medium for leaves of intermediate size (tomato, goldenrod), and High for large leaves (corn).

Temperature in Degrees Celsius: Drag the arrow on the slider bar to change the temperature. The default setting is 25 degrees. You can also type values directly into the text box to the right of the slider.

Carbon Dioxide in ppm (parts per million): Drag the arrow on the slider bar to change the concentration of carbon dioxide in the air flowing over the leaf. You can also type value directly into the text box to the right of the slider. The default setting is 350 ppm (normal atmospheric levels).

Light Intensity (in micromoles of photons per square meters per seconds): Drag the arrow on the slider bar to change the light intensity. The default setting is 0. You can also type values directly into the text box to the right of the slider.

Light Filters: Choose white, red, green, or blue to investigate how light quality affects photosynthesis.

Carbon Dioxide Output: The rate of carbon dioxide output is graphed here. Changing the controls causes a perturbation to the experimental system which appears as jagged lines. What until the output becomes constant before recording a measurement.

Experiment Number (Expt #): Use the up and down arrows to choose different numbers to represent different experiments.

Record: Click this button to record an observation. A vertical line will appear on the chart to indicate your measurement. These data values will be recorded in a table you will see in the Prepare Data window.


Prepare Data
Prepare Data
Prepare Data
Click in the data table to select the rows you want and click Compute to calculate the photosynthetic rate. You can drag or click the mouse with the Shift key pressed to select multiple rows. Click Add to Notes to save the selected data in your notebook. Click Delete Selected to delete the selected data from the data table.

Plot Data (Data Tab)

Title: Create a title for the plot by typing a name in the text field.

Plot: You can create several separate plots. Use the up and down arrows to choose a number to identify each plot. Plots appear as new tabs in this window.

X-axis: Use the pull down menu to choose Light or CO2 as the variable to be plotted on the x-axis.

Data for Curve: You can fit separate curves to different groups of data points that you want to compare on the same graph, for example, data from different leaves, temperatures, or colors of light. Use the up and down arrows to choose a number to identify different groups of data on the same plot.

Symbol: Choose a symbol (square, circle, diamond, cross) to identify the plot points for different groups of data.

Color: Choose a color to identify the plot points and curves for different groups of data.

Plot Selected Data: Adds the selected group of data to the plot.

Add to Notes: Saves the selected data in your notebook.

Delete Curve: Removes group of data identified in the Data for Curve field from the plot.


Plot Data (Plot Tabs)

Curve: If you plotted more than one group of data, use the up and down arrows to choose the data group that you will use for fitting a curve.

Intercept: This is the point at which the curve intersects the y-axis. Use the up and down arrows or type a value in the text field to change the intercept for the selected curve.

Slope: This is the initial steepness of the curve. Use the up and down arrows or type a value in the text field to change the slope for the selected curve.

Asymptote: This is the point on the y-axis at which the curve levels off. Use the up and down arrows or type a value in the text field to change the asymptote for the selected curve.

Error SS: This is the error sum of squares. It is the sum of the squared differences between the data and the curve. A smaller value indicates a better match of the curve to the data. Adjust the intercept, slope, and asymptote so as to minimize this value.

Export Graph: Obtain a copy of the plot in a new web browser window. You can print the plot or save the plot as a file using your web browser controls.

Delete Plot: Remove the entire plot from the applet. (The data will not be deleted.)

Add to Notes: Saves the selected data in your notebook.


NOTEBOOK

As you run experiments, form hypotheses, and test them, you should keep notes on your hypotheses and findings in the LeafLab Notebook.