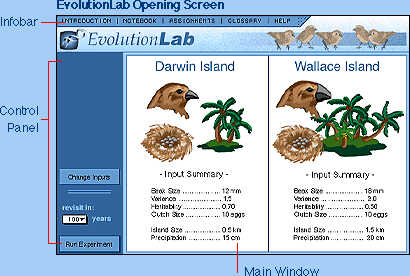

| GENERAL CONTROLS |
Notebook: Record your own notes on the results of the lab--your hypotheses, details about results, and conclusions. You can also move data from the Results pages directly to the Notebook - see Exporting.
Assignments: Doing the assignments is critical to understanding the concepts of this lab. The Assignments here were written to benefit a wide range of general biology classes and you should find them helpful, but check with your instructor before proceeding with any Assignments.
Glossary: The glossary contains definitions for selected terms in the lab.
Help: Brings you to this screen.
NOTEBOOK
As you run experiments, form hypothoses and test them, you should keep notes on your theories and findings in the EvolutionLab notebook. You may access the notebook at any time from the Infobar. The notebook will open up in a separate window.
Control Buttons: You will see a row of control buttons at the bottom of the notebook window. These include Close, Export, and Undo Edit.
Export: The current contents of the notebook are exported to a temporary HTML file. This file is then opened in your browser. Exporting your notes allows you to print them when you are done with your assignment. NOTE: extremely long notes will cause machines to hang when trying to export. If you are running many experiments it is best to print your notes and clear the notebook occasionally.
Undo Edit: Any changes you have made to the notebook since it was last opened will be removed, restoring it to its state when it was opened.
| INPUT SCREEN |

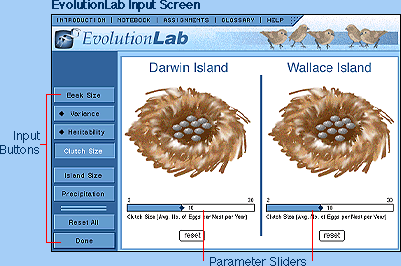
INPUT BUTTONS
Input buttons allow you to change variable information to allow you to make comparisons between many different hypothetical evolutionary situations. Clicking on any of the input buttons in the left hand panel will bring up the controls for that variable in the right hand panel.
Change Inputs: Click this button to delete all previously input information.
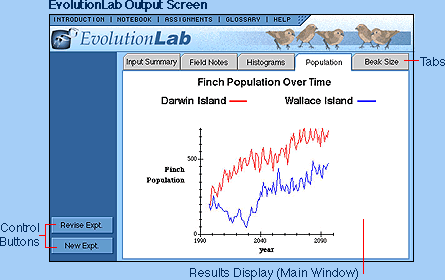
New: Click this button when you want to start on a completely new experiment.
Revise: Click this button to revise variables in selected input parameters from previous experiments.
Done: Click this button when you have finished setting all input parameters.
PARAMETER SLIDERS
The different parameters in EvolutionLab are changed by using
Sliders to increase or decrease the value for each variable parameter.
Ideally, you want to compare different values for any one parameter
on each of the two hypothetical islands, Wallace Island and Darwin
Island. The parameters are the following:
Heritability: This measures the genetic contribution to beak size and can vary from 0 to 1, with zero representing no genetic contribution (all differences are caused by the environment) and one representing no environmental contribution (all differences between individuals are due to genetics).
Variance: This is a measure how much different the beak size is from one bird to the next, and can be varied from 0.0 mm to 2.0 mm. At 0 mm all of the birds have the same beak size, at 2.0 mm there is wide variation in beak size with some birds having beaks 3 or 4 mm larger or smaller than the mean
Clutch Size: The number of eggs laid by each female finch can range from 2 to 30. The higher numbers actually reflect multiple clutches in one year.
Island Size: This determines the size of each island, and is measured in kilometers (km). Larger islands can support larger populations of birds.
Population: The initial finch population on each island.
Precipitation: The average rainfall influences the numbers and types of seeds the birds feed on, and is measured in centimeters (cm).
| OUTPUT SCREEN |

RESULTS
Results are given automatically after the Run button
is clicked and an experiment is completed. The results are presented
in various forms which can be accessed by clicking on the appropriate
button in the frame on the left side of the page:
FIELD NOTES
A table of the raw data on the population and mean
beak size on each island, for each year.
HISTOGRAMS
Bar graphs illustrate the numbers of surviving birds
versus total birds and relative beak sizes on each island. The
horizontal line or x-axis shows beak size, and the vertical line
or y-axis shows number of birds. The thin red and blue vertical lines
which appear near the middle of the histogram represent the mean beak
sizes for the surviving birds and the total birds respectively.
BEAK SIZE:
A line graph shows average beak size over time on the
two islands.
POPULATION:
A line graph shows finch population over time on
the two islands.
INPUT SUMMARY:
A chart shows all input parameters and the values
entered for each island.