 |
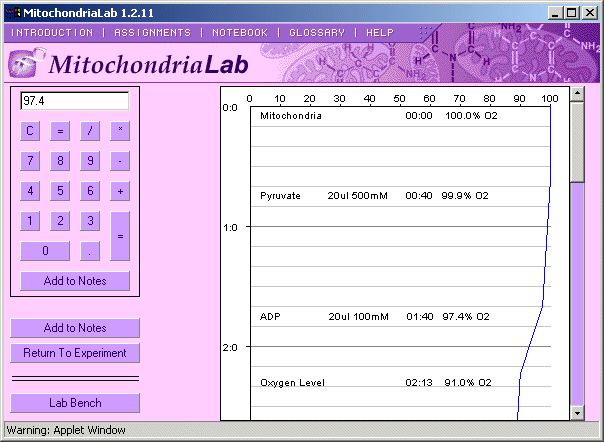
In this view the strip chart of oxygen concentration is analyzed in detail. Critical events are recorded during the simulation. Changes in rates of oxygen consumption in response to experimental manipulation are used to infer the biochemical pathways of the Krebs cycle. |